


Core Web Vitals have become one of the most important ranking factors for Google. Whether you’re an SEO professional, developer, or business owner, optimizing Core Web Vitals is essential for delivering a fast, smooth, and user-friendly experience.
But before you optimize anything, you need the right tools to test, measure, and monitor your website’s real-world performance.
In this guide, we break down the 10 best tools to test and monitor Core Web Vitals performance, along with what makes each tool valuable and how you can use them to improve your site’s UX and SEO.
What Are Core Web Vitals?
Core Web Vitals are a set of performance metrics used by Google to evaluate page experience. They measure loading speed, interactivity, and visual stability.
The three main Core Web Vitals are:
1. LCP (Largest Contentful Paint)
Measures how fast the main content loads.
Goal: Under 2.5 seconds
2. INP (Interaction to Next Paint)
Measures responsiveness and delay after user interactions.
Goal: Under 200 milliseconds
3. CLS (Cumulative Layout Shift)
Measures how stable elements remain while loading.
Goal: Less than 0.1
If your site performs well in all three areas, users enjoy smoother navigation and Google rewards you with better rankings.
Read more: What Are Core Web Vitals and Why They Matter for SEO?
The 10 Best Tools to Monitor Core Web Vitals
Below are the top-performing tools used by SEO experts, developers, and site owners to evaluate and optimize website performance.
1. Google PageSpeed Insights
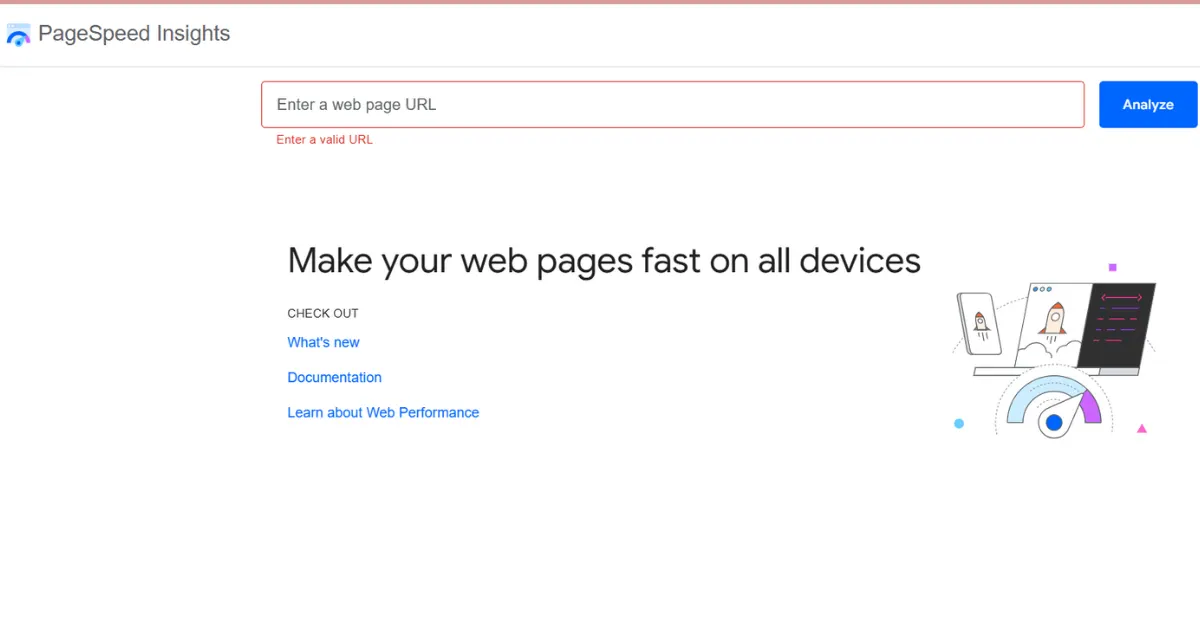
Best For: Overall performance analysis & detailed field/lab insights
Google PageSpeed Insights (PSI) is the most popular tool for Core Web Vitals analysis. It uses field data from the Chrome UX Report (CrUX) and lab data via Lighthouse.
Key Features
- Real user (field) and simulated (lab) data
- Total Core Web Vitals score and color-coded grading
- Opportunities and diagnostics for performance improvements
- Device-level insights (mobile + desktop)
Why It’s Powerful
PSI gives you the most accurate real-user experience metrics because they come directly from Chrome users across the web.
2. Google Search Console (Core Web Vitals Report)
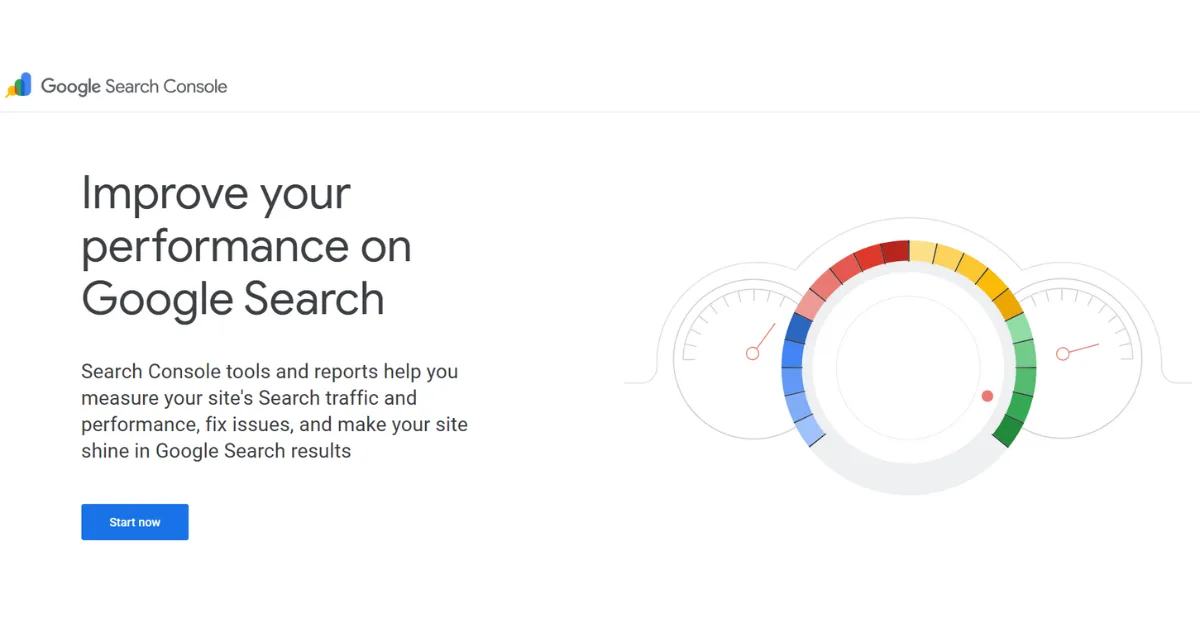
Best For: Long-term monitoring of whole-site performance
Search Console identifies Core Web Vitals issues across your entire domain, not just individual pages.
Key Features
- URL grouping by performance level (Good / Needs Improvement / Poor)
- INP, LCP, and CLS trends across weeks or months
- Detailed breakdown of affected URLs
- Clear prioritization for fixes
Why It’s Powerful
Perfect for monitoring Core Web Vitals at scale, especially when you want to evaluate performance for hundreds or thousands of URLs.
3. Lighthouse (Chrome DevTools)
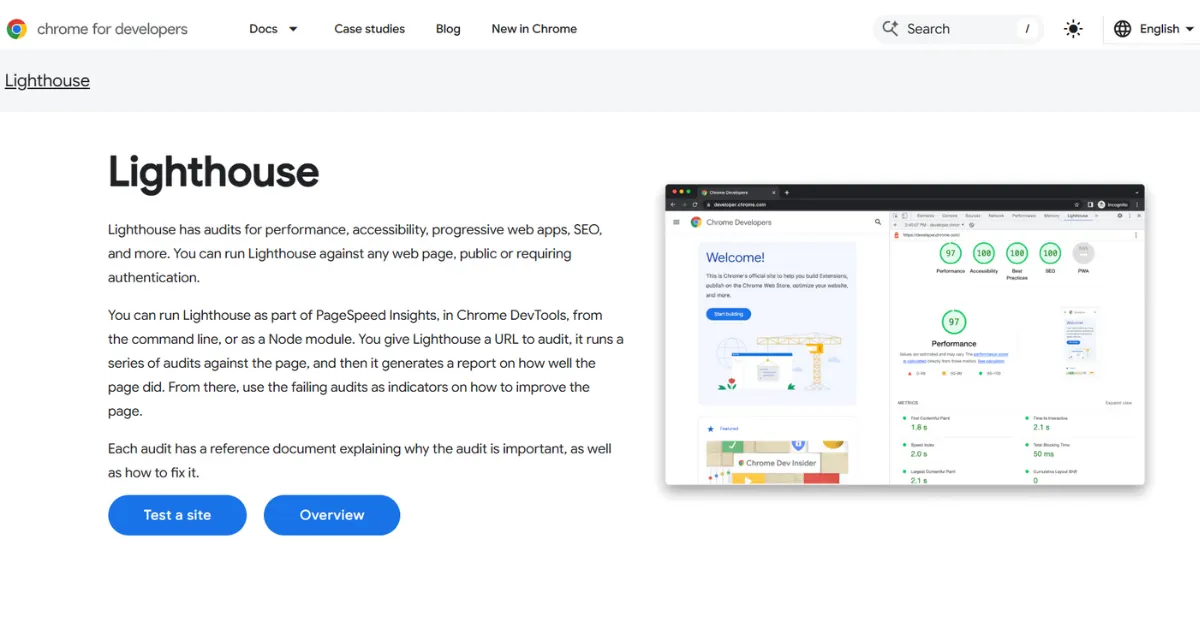
Best For: Developers analyzing performance in real time
Lighthouse runs directly inside Chrome DevTools and is ideal for deep analysis and debugging.
Key Features
- In-depth Core Web Vitals scoring
- Performance insights based on real browser simulation
- Testing on throttled (slow) networks
- Diagnostics for JavaScript, CSS, and layout shifts
Why It’s Powerful
It’s a developer-centric tool that helps you trace performance bottlenecks at a granular level.
4. GTmetrix
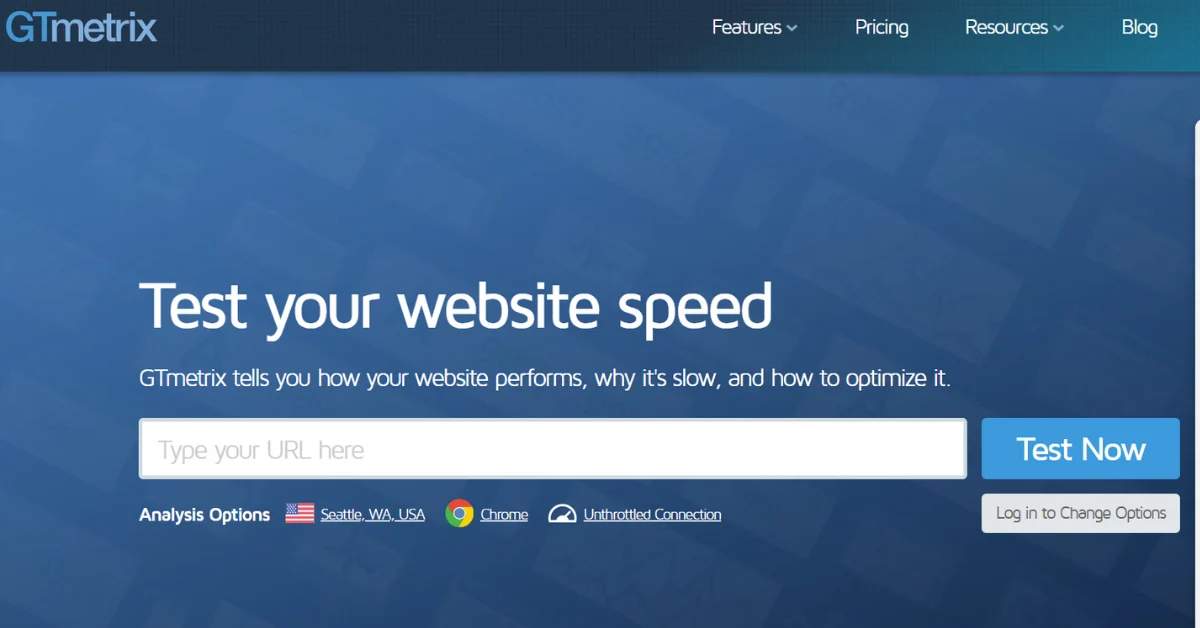
Best For: Visual waterfall charts & speed optimization insights
GTmetrix offers detailed performance breakdowns with easy-to-understand reports.
Key Features
- Waterfall charts showing request timings
- LCP, INP, and CLS breakdown
- Video playback to see how fast your page loads
- Regional testing (test from different countries)
- Device testing (desktop and mobile)
Why It’s Powerful
GTmetrix combines speed analysis with clear visuals that help beginners and advanced users identify slow elements affecting Core Web Vitals.
5. WebPageTest
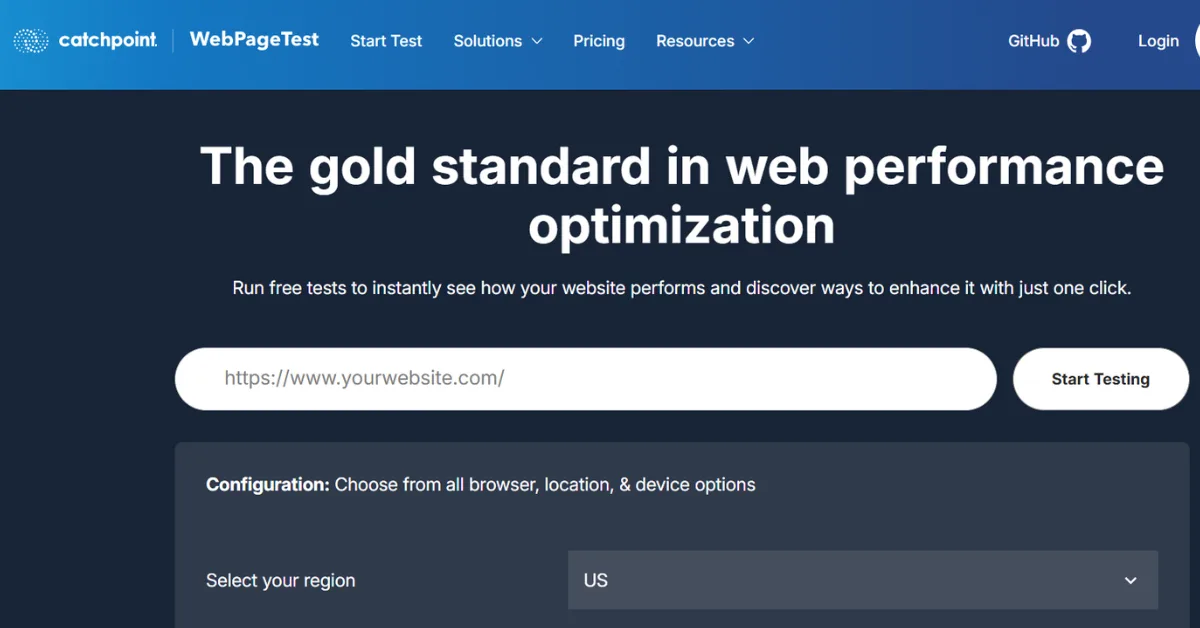
Best For: Advanced, professional-grade performance audits
WebPageTest is one of the most comprehensive performance-testing platforms used by developers worldwide.
Key Features
- Multiple test locations and device types
- Extremely detailed filmstrips and waterfalls
- Timings for LCP, INP, CLS, TTFB, and more
- Real device testing
- Advanced scripting and automation
Why It’s Powerful
Its depth of insights helps identify specific rendering or blocking issues that simpler tools may miss.
6. Chrome User Experience Report (CrUX Dashboard)
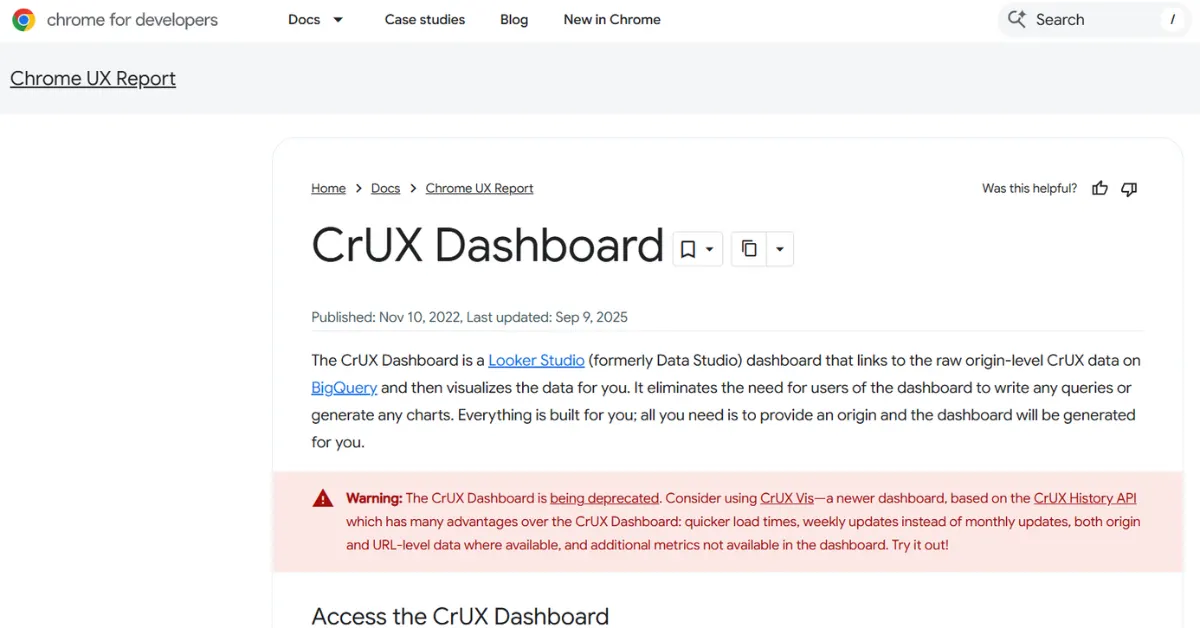
Best For: Real-user metric tracking & visual dashboards
The CrUX Dashboard is powered by Google’s BigQuery dataset and can be visualized through Looker Studio.
Key Features
- 100% real-world performance metrics from Chrome users
- Country-level and device-level performance segmentation
- Custom dashboards and monthly trend comparisons
- Official Google dataset
Why It’s Powerful
If you want to track how Core Web Vitals improve over months, CrUX gives the most reliable real-user data available.
7. Pingdom Website Speed Test
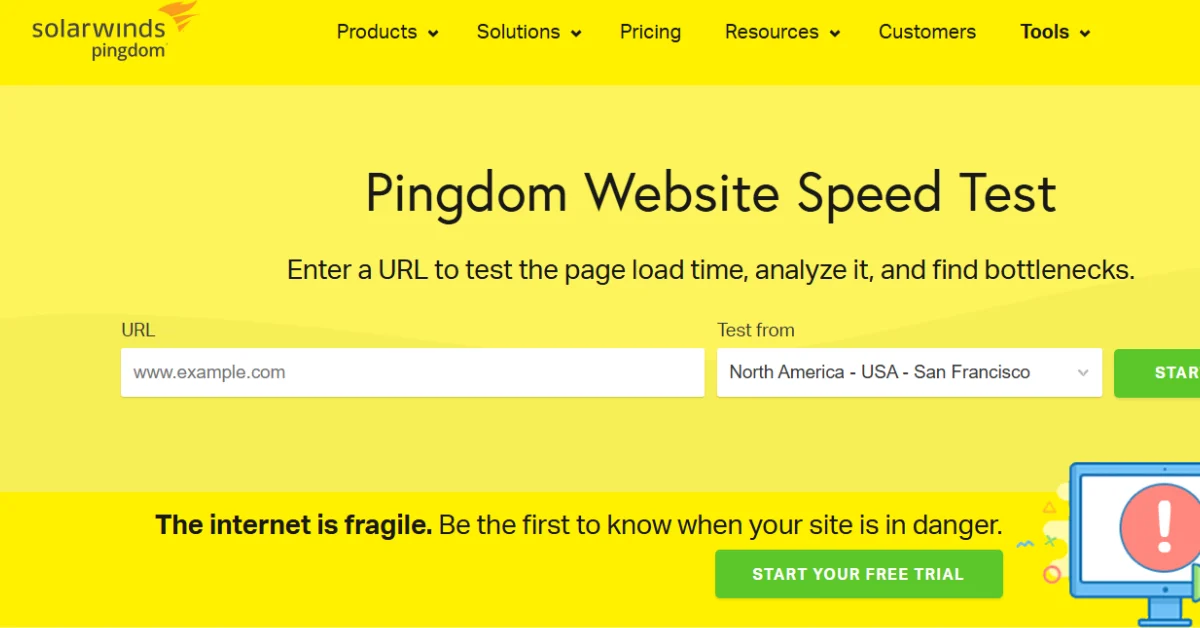
Best For: Simple, beginner-friendly performance checks
Pingdom is great for quick, lightweight speed tests.
Key Features
- Page size, requests, and load time
- Summary of performance issues
- Breakdown of content types (images, scripts, fonts)
- Regional testing
Why It’s Powerful
Even though Pingdom doesn’t directly show INP or CLS, it helps identify general speed issues impacting Core Web Vitals.
8. Treo Site Speed
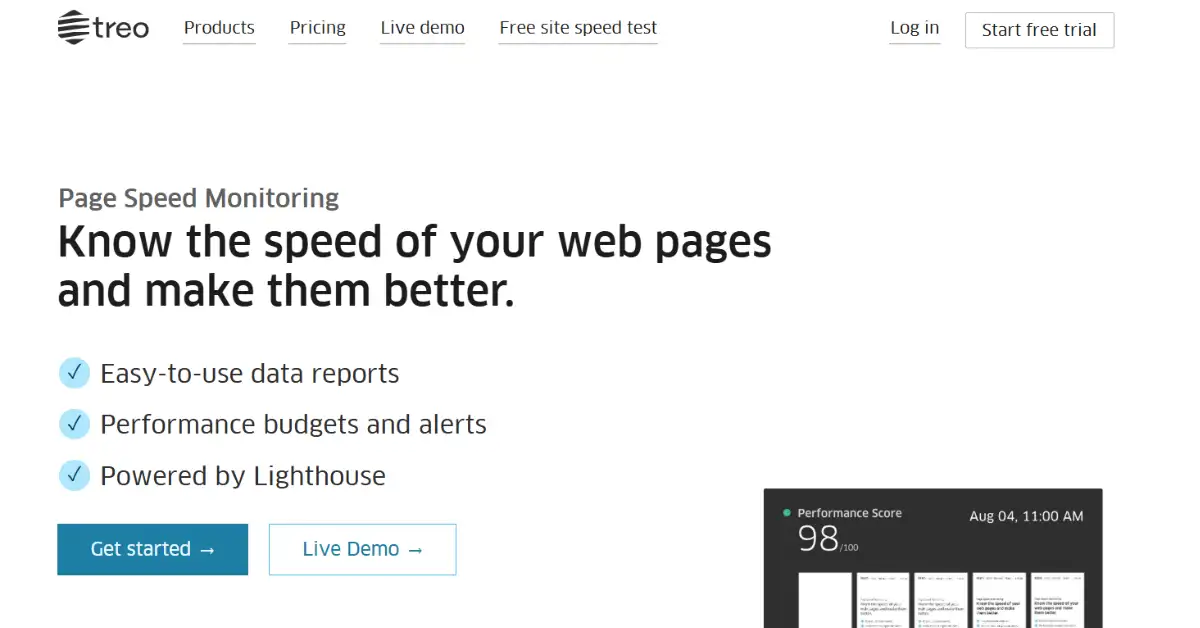
Best For: Competitive Core Web Vitals comparison
Treo helps you benchmark your performance against industry competitors.
Key Features
- Public CrUX data for your domain
- Trend charts for LCP, CLS, and INP
- Competitor comparison dashboard
- Mobile vs desktop performance splits
Why It’s Powerful
It’s one of the few tools that show how your Core Web Vitals stack up against your competitors.
9. Cloudflare Web Analytics

Best For: Privacy-focused real-user monitoring (RUM)
Cloudflare has built an analytics tool that monitors website performance directly from its CDN.
Key Features
- Real-user performance insights
- Visualization of Core Web Vitals across time
- Traffic and UX data in one dashboard
- 100% privacy-compliant
Why It’s Powerful
Because Cloudflare sits between your server and users, it can capture performance insights without slowing anything down.
10. New Relic Browser Monitoring

Best For: Large websites & enterprise-level monitoring
New Relic provides full-stack monitoring and real-user performance analytics.
Key Features
- Real-time Core Web Vitals tracking
- JS and error monitoring
- Performance data across browsers and locations
- Application performance monitoring (APM) integration
- Alert setup for performance drops
Why It’s Powerful
It’s excellent for large-scale websites that require continuous monitoring and immediate alerting.
How to Choose the Right Core Web Vitals Tool
Choosing the right Core Web Vitals tool is essential to understand and improve your website’s performance. Different tools offer different types of insights, so selecting the right one depends on your specific needs. Using the appropriate tools can save time, provide accurate data, and help you make meaningful improvements.
Recommended Tools Based on Purpose:
Real-user data: CrUX and Google Search Console show how actual visitors experience your site.
Detailed debugging: Lighthouse and WebPageTest help pinpoint technical issues affecting speed and performance.
Speed optimization insights: GTmetrix and Pingdom provide actionable recommendations to make pages faster.
Competitor benchmarking: Treo allows you to compare your site’s performance with industry competitors.
Enterprise monitoring: New Relic is ideal for large-scale websites needing continuous performance tracking.
Overall performance score: PageSpeed Insights offers a quick summary of your website’s Core Web Vitals.
By using 2–3 of these tools together, you can get a more accurate view of your website’s performance and make data-driven improvements that enhance user experience.
Read more: How to Improve INP Score
How Often Should You Test Core Web Vitals?
Maintaining strong Core Web Vitals is an ongoing process, not a one-time task. Regular monitoring ensures your website stays fast, responsive, and user-friendly. Performance can fluctuate due to content updates, plugin changes, theme adjustments, or sudden traffic spikes, so consistent testing is crucial.
Here’s a simple schedule to keep your site in top shape:
Test key pages weekly: Focus on your homepage, landing pages, and high-traffic posts. Weekly checks help you spot performance issues before they affect user experience.
Monitor sitewide performance monthly: A broader monthly review helps identify trends, uncover slow-loading sections, and track overall improvements.
Track real-user metrics continuously: Use tools like Google Search Console or CrUX to keep an eye on how visitors experience your site in real-time.
Run checks after major updates: Every time you update themes, plugins, or make significant code changes, re-test to ensure nothing breaks your performance.
By following this routine, you can catch problems early, respond quickly to performance drops, and maintain a seamless browsing experience for your users. Consistent monitoring is the key to keeping your website fast, reliable, and search-engine friendly.
Top Tips to Improve Core Web Vitals Quickly
Once you analyze performance, here are quick wins:
1. Reduce LCP
- Compress and lazy-load images
- Use next-gen formats (WebP, AVIF)
- Upgrade hosting or use CDN
- Optimize hero banners
2. Reduce INP
- Minimize heavy JavaScript
- Use code splitting
- Remove unnecessary scripts
- Prioritize user input responsiveness
3. Reduce CLS
- Set fixed height/width for images
- Preload fonts
- Avoid dynamic ads without placeholder space
- Stabilize layout elements
Optimizing these three areas will significantly enhance user experience and help search rankings.
Frequently Asked Questions
1. What are Core Web Vitals?
Core Web Vitals are Google’s essential performance metrics that measure loading speed, responsiveness, and visual stability of a webpage. They help determine how smoothly users experience your site. Better Core Web Vitals lead to higher engagement and stronger SEO performance.
2. Which tool is best to test Core Web Vitals?
Google PageSpeed Insights is the best tool for quick and reliable testing. It provides real-user data and lab metrics along with actionable suggestions. If you want deeper insights, Lighthouse and WebPageTest are excellent advanced options.
3. How often should I check Core Web Vitals?
It’s best to monitor Core Web Vitals at least once a week for important landing pages. Regular testing helps you identify issues early before they affect traffic or rankings. After major site updates, run fresh tests immediately.
4. Why is LCP important?
LCP (Largest Contentful Paint) tracks how quickly the main content of a page becomes visible to users. A fast LCP keeps users engaged and reduces bounce rates. Slow LCP often indicates heavy images or server delays that need optimization.
5. What causes poor CLS scores?
Poor CLS (Cumulative Layout Shift) happens when page elements move unexpectedly while loading. This is usually caused by images without fixed dimensions, ads loading late, or shifting fonts. Fixing these improves visual stability and user trust.
6. Can Core Web Vitals improve SEO?
Yes, Core Web Vitals are part of Google’s Page Experience signals and can influence your search rankings. Websites that load faster and feel smoother often see better visibility and engagement. Optimizing these metrics is great for both users and SEO.
7. Are free tools enough to monitor Core Web Vitals?
For most websites, free tools like PageSpeed Insights, Search Console, and Lighthouse provide everything needed to evaluate performance. They cover both field and lab data along with clear recommendations. Paid tools are useful mainly for large or enterprise sites.
8. How long does it take to see changes in Core Web Vitals?
Lab data updates immediately after optimization, so you can instantly see results in tools like Lighthouse. However, real-user field data may take up to 28 days to fully update in Google Search Console. This ensures improvements reflect actual user behavior.
Final Thoughts
Core Web Vitals are no longer optional they’re essential for SEO, user experience, and conversions. With the right tools, you can easily test, track, and optimize your website’s performance to meet Google’s standards.
The 10 tools we covered above give a complete monitoring system from real-user analytics to deep technical debugging. Start by analyzing your current performance using PageSpeed Insights or Search Console, then gradually improve your metrics using advanced insights from tools like WebPageTest, GTmetrix, or Lighthouse.
When your Core Web Vitals are strong, your website becomes faster, smoother, and better for both users and search engines.